TheStrat MTF High/LowI just started learning about #TheStrat by Rob Smith. I created this tool as it helps me see the bigger TFs over my short TF periods. It plots the Highs and Lows of the current and past Quarter, Month, Week, Day, 6hour, and 1hour. (I added the 6 hour for myself for use with cryptos which run 24 hours). It leaves the previous Highs/Lows plotted as well so you can see how the candles are moving within the bigger candlestick . Example, if you select the 15 minute candlestick , it will also list the current high/low for the 1h, 6h, D, W, M, and Q.
It has customization that will disable whatever TF's you are not interested in.
It has auto-detect and disable lower TFs that are less than or equal to the current selected TF. This function will only work to disable when one of the above mentioned periods is selected. Example, if you select the M candle, it will disable the M, W, D, 6h, and 1h. Only the bigger TF of the Q will be visible. Example of when function wont work, if you selected the 2 Month candle it will not disable any of the TFs.
I am open to any ideas that you experienced Stratters offer. As soon as I get better at the system and generate some income for myself, I will likely make it open source. Hope this helps.
Search in scripts for "high low"

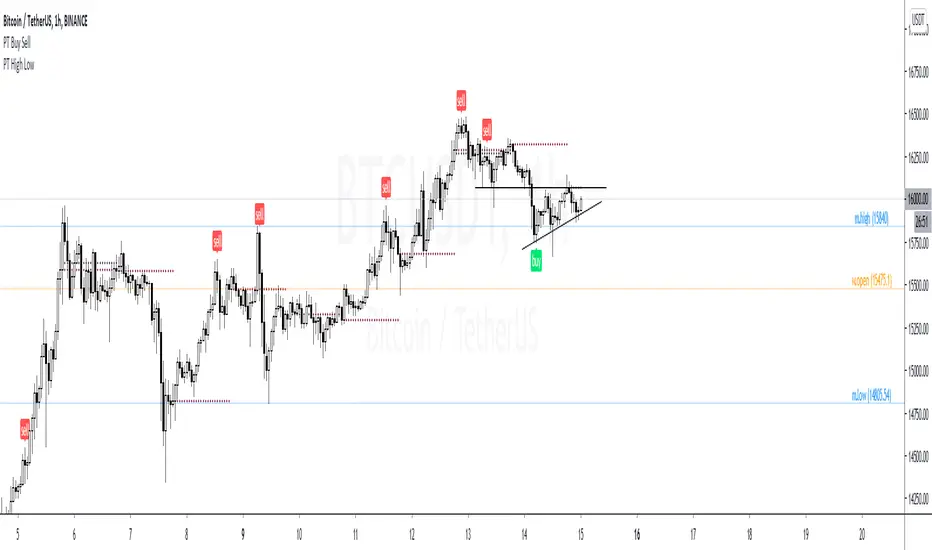
PT High Low Version 1.0 of our PT High Low indicator helps create a visual for the Daily, Weekly, Monthly & Yearly range. These levels will give you an idea of where the price can react if reached. Consider them pivotal areas. We included a toggle that will help you go between the candle's High/Low to the candle's Open/Close. Both features are unique when scalping & swinging. The High/Low will paint a beautiful visual for your day to day trading & the Open/Close will help you determine where price maxed opened & closed for that specified timeframe.
Strategy:
Price tends to gravitate between the Daily level when playing intraday scalps. If playing the weekly, you want to be above the weekly pivot to punt longs & under the weekly level to punt shorts. More likely than not, when the price hits a monthly or yearly level, we get a noticeable reaction off it.
This Oscillator was built around our buy sell indicator & it is used on all time frames for swinging & scalping. It is included as part of the library. Just message us for access!
Futures Open/High/Low TablesAdds (up to) 3 tables to a chart, displaying Open/High/Low data for today (RTH and extended hours), yesterday, and the current week / month -- to help with intraday analysis of a futures ticker.
The tables only appear on intraday charts (5min, 30min, etc). On a Daily/Weekly/etc chart they are not calculated or shown.
In addition to Open/High/Low, the "Current" table in the top-right shows a live measurement of # of points from the open, the RTH open, and the highs/lows.
Lastly, the 9:30am ET open and the 4pm RTH close are by default marked with a shaded background (on intraday charts) for easy visual reference, and also to help with adjusting the session time to accommodate time zone issues if they occur.
Tested on ES in Eastern Time Zone, but should work on any futures instrument and any time zone by adjusting the Session Time setting.

ORTI Swing High Low / Support Resistance (Static TFM)The "ORTI Swing High Low / Support Resistance (Static Timeframe Multi-Period)" is based into existing studies that shows support and resistance levels taking as reference the highest and lowest points of certain periods, as a redesigned and recalculated set of the common plotted lenght.
The cherry on the top for this version is, when you want to get a predetermined count in (ranges) units of time, as: minutes, hours or days, in any a intraday graph you could get a static lenght, and this count will be automatically respected. For example, an average could be configured to know a high or low levels per hour, day, week or month ... or whatever comes to mind, and at every single chart that you move through (5m, 15m, 1h, 4h, etc), you will see the same lenght to make your own "support and resistance analysis" into a micro / macro market view.
Remember that part of analyzing chart patterns, the support and resistance levels are undoubtedly two of the most highly discussed attributes of technical analysis. Part of analyzing chart patterns, these terms are used by traders to refer to price levels on charts that tend to act as barriers, preventing the price of an asset from getting pushed in a certain direction.
With the new features, you will get a little help to identify in your technical analysis some signals to identify price points on a chart where the probabilities favor a pause or reversal of a prevailing trend. Support and resistance areas can be identified on your charts using this indicator.
For more technical information look at Investopedia.
Note: The previous calculation example is not the default, the parameters can be adjusted according to the criteria of the merchant.

Extension of High, Low and InbetweenThis script plots an extension my other script High, Low, Inbetween.
It sometimes makes it difficult to view the candles effectively so I've added this separately to my other script
It calculates the range between high/low and midpoint.
It then plots these lines as extensions from the high and low.
This is done twice.

Multiple SMAs + X-Bar High/LowWhen starting my daily analysis, I typically open a daily chart and check where the price is compared to several SMAs, as well as check the high/low of today and the 10-day high/low. This indicator was designed to save chart space as well as make finding the highs and lows more efficient. Everything is adjustable, so you don't have to stick with my 10-bar rule.

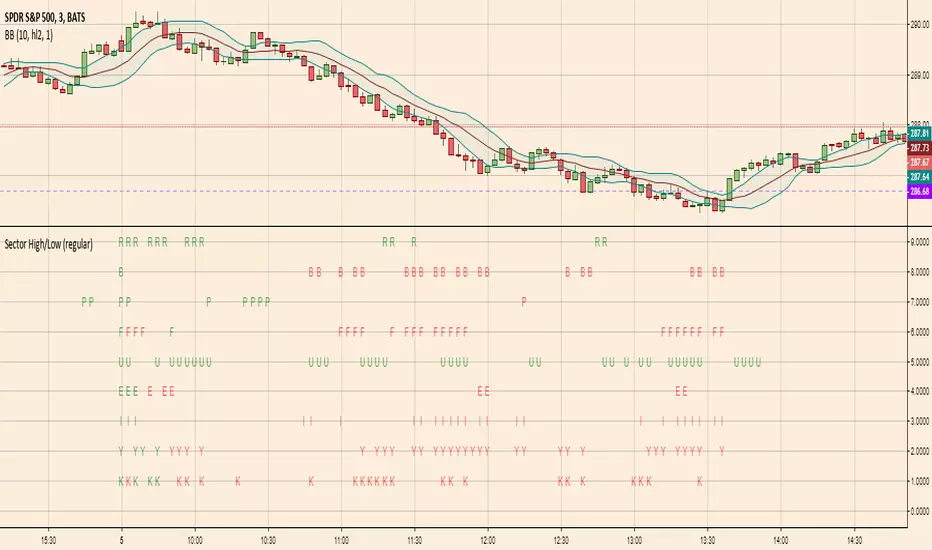
Sector High/LowHighlights which S&P SPDR Sector ETFs are at highs of day (green letter) or lows of day (red letter)
The first candle of the day is always all-green because by default the first candle of the day has the high of the day. So this indicator is more meaningful later in the day when sectors are making repeated highs/lows
Multi-Timeframe Open & High/Low MarkersWill mark opening of month week quater year as input via user.
Also give option to mark high low at Specified Time Frame
One can use reference that if CMP is above monthly opening of High Low the script is bullish
and vice versa

Session High/Low indicator Session High/Low – London & Asia” is a TradingView indicator that automatically identifies and marks the single highest high and lowest low of each London and Asia trading session. At the close of each session, it draws clean horizontal rays extending to the right—one at the exact bar where the session’s peak price occurred and one where the trough occurred—so you can instantly spot key support and resistance levels without cluttering your chart.

Fib High Low PointsThis is a simple indicator which plot high and lows based on Fibonacci sequence.
Best part of this indicator is it don't rewrite itself once it got plotted on the chart, which make it unique from other High low indicators.

Kozlod - All-time high/low alertsA small script to track all-time high/low levels.
You can create alerts when levels will be updated.
[ttcHugo] 3 Days OPEN/HIGH/LOW LINES It's a simple and basic tool for OPEN/HIGH/LOW lines in each day of recently 3 days. I will build more tools in the future. If you find it is useful for you please follow me and have any advise please contact me thank you.
Draw Line For High Low Custom Range Interactive█ OVERVIEW
This indicator is an educational indicator to make pine coders easier to how to use interactive inputs with User-Defined Type (UDT) especially when dealing input.time.
█ NOTES
This indicator is not perfect but it is a good starting point or template to start develop custom range interactive indicator.
█ INSPIRATIONS
ABC 123 Harmonic Ratio Custom Range Interactive
XABCD Harmonic Pattern Custom Range Interactive
PriceTimeInteractive
█ CREDITS
CAGR Custom Range
Pine scripts are now interactive
█ FEATURES
1. High Low points are determined based on points selected.
2. Line will be drawn after points are correctly arranged.
3. Label show error once wrong point is selected, move the point as instructed in example.
█ EXAMPLES / USAGE

Pivots High Low (HH/HL/LH/LL)/Trend [Anan] Hello Friends,,
This is pivot points high low with pivot trend to define the trend direction.
Pivot trend is the pivot points average.
Options:
- Pivot Point Period
- Show/hide Pivot Points Labels
- Show/hide Bull/Bear Labels ( depends on pivot trend)
- Show/hide Pivot Center Line (Bull>Center, Bear

Candle (High/Low/Close)-MTF [Anan]
Hello Friends,,
This is just multi time frame candle plot (High / Low / Close) on your current chart resolution.


Middle-High-Low Moving AverageThis indicator was originally developed by Vitali Apirine (Stocks & Commodities , V.34:9 (August, 2016): "The Middle-High-Low Moving Average").
You can use it to create a crossover trading system in conjuction with EMA/SMA.
Good luck!
Price Open/High/Low/CloseAnother indicator that shows Open, High, Low, Close on multiple timeframes.
It can be used to discover possible support/resistance areas on lower timeframes.
Other indicators may do the same thing but just added some custom timeframes
Daily High/Lowmodified version of Mike Witts Daily High/Low indicator.
This is a simple change that removes the 1-day offset from the indicator.

Previous Daily Open/High/Low/CloseThis indicator plots the previous day's open, high, low and close levels on the chart
Published by Luke (DisciplinedTrader.co.uk)

Highs, Lows & SessionsHigh Low & Sessions Indicator - Purpose & Usage
The High Low & Sessions indicator is designed to provide key price levels and session-based market insights to help traders make informed decisions. It focuses on daily highs/lows, weekly highs/lows, and major trading sessions to identify support, resistance, and volatility patterns.
Key Functions of the High Low & Sessions Indicator:
Tracks Daily & Weekly Highs and Lows
Previous Day’s High & Low: Helps traders identify breakout points and potential reversals.
Previous Week’s High & Low: Provides key resistance/support levels for swing trading strategies.
Trading Session Zones
London Session: High volatility, often setting the daily trend.
New York Session: Strong liquidity, continuation or reversal of the London move.
Asian Session (Tokyo & Sydney): Lower volatility, potential accumulation phase.

High/Low Historical Volatility Bands [Loxx]High/Low Historical Volatility Bands are constructed using:
Average as the middle line.
Upper and lower bands using the Historical Volatility high/low (instead of "regular" Historical Volatility) for bands calculation.
What is Historical Volatility?
Historical Volatility (HV) is a statistical measure of the dispersion of returns for a given security or market index over a given period of time. Generally, this measure is calculated by determining the average deviation from the average price of a financial instrument in the given time period. Using standard deviation is the most common, but not the only, way to calculate Historical Volatility .
The higher the Historical Volatility value, the riskier the security. However, that is not necessarily a bad result as risk works both ways - bullish and bearish , i.e: Historical Volatility is not a directional indicator and should not be used as other directional indicators are used. Use to to determine the rising and falling price change volatility .
SH is stock's High price in t day.
SL is stock's Low price in t day.
High/Low Return (xt^HL) is calculated as the natural logarithm of the ratio of a stock's High price to stock's Low price.
Return:
And Parkinson's number: 1 / (4 * math.log(2)) * 252 / n * Σ (n, t =1) {math.log(Ht/Lt)^2}
An important use of the Parkinson's number is the assessment of the distribution prices during the day as well as a better understanding of the market dynamics. Comparing the Parkinson's number and periodically sampled volatility helps traders understand the tendency towards mean reversion in the market as well as the distribution of stop-losses.
The color of the middle line, unlike the bands colors, has 3 colors. When colors of the bands are the same, then the middle line has the same color, otherwise it's white.
Included
Alerts
Signals
Loxx's Expanded Source Types
Bar coloring
Related indicators:
Parkinson's Historical Volatility Bands
Historical Volatility Bands
